Cross Tabulation (Basic)
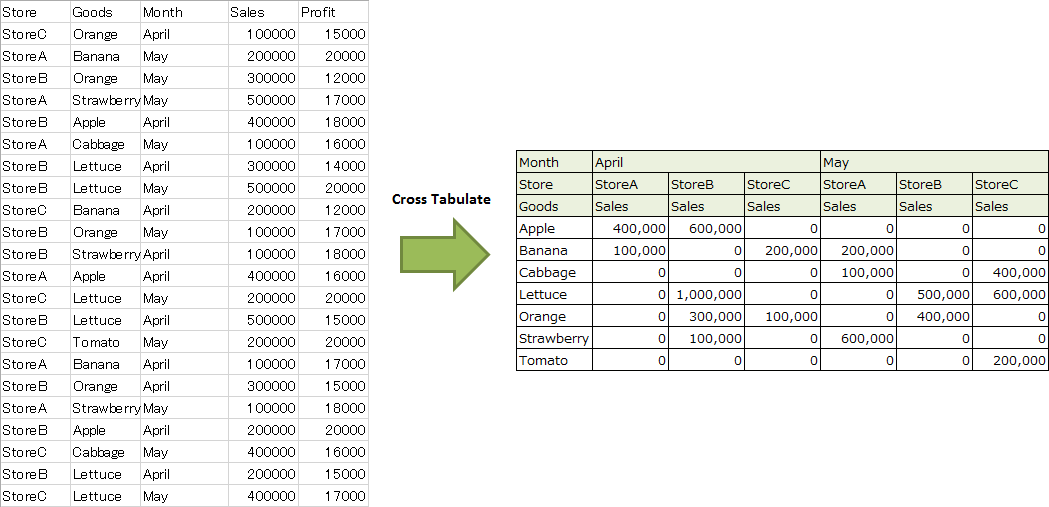
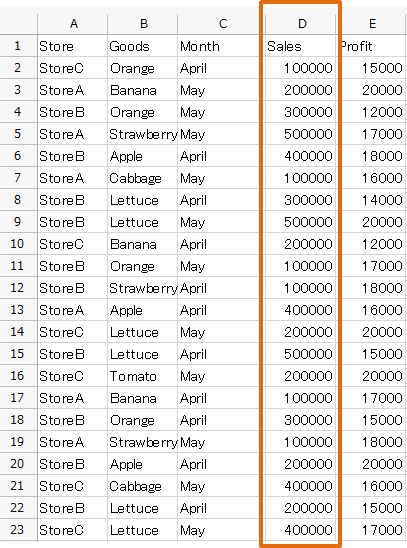
Cross Tabulation is the way to analyse and summary the data by selecting the fields from the given data.
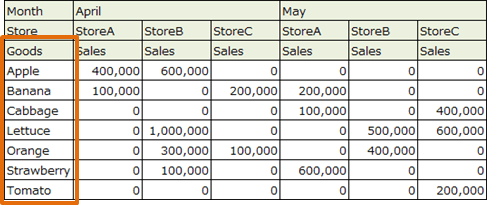
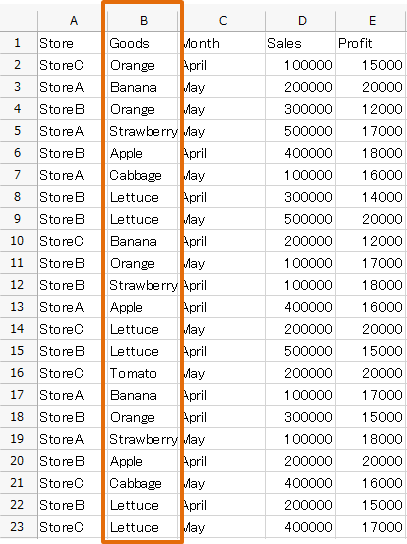
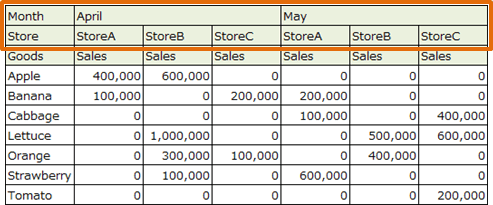
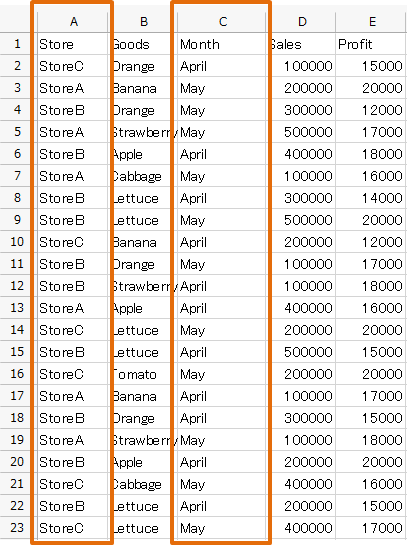
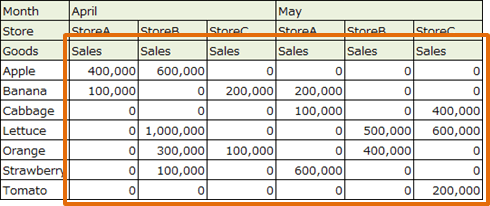
For example, the data on the left side is summarized and the table on the right side is created as follows.
This is the procedure for Cross Tabulation as follows.
- Set Target Summary Data
- Set how to summarize
- Set how to output
Set Target Summary Data
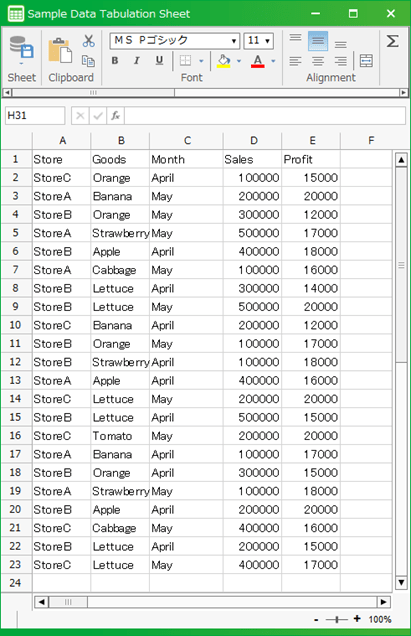
- Create the target summary data in the application sheet.
- Create the button for Cross Tabulation and action set by clicking.
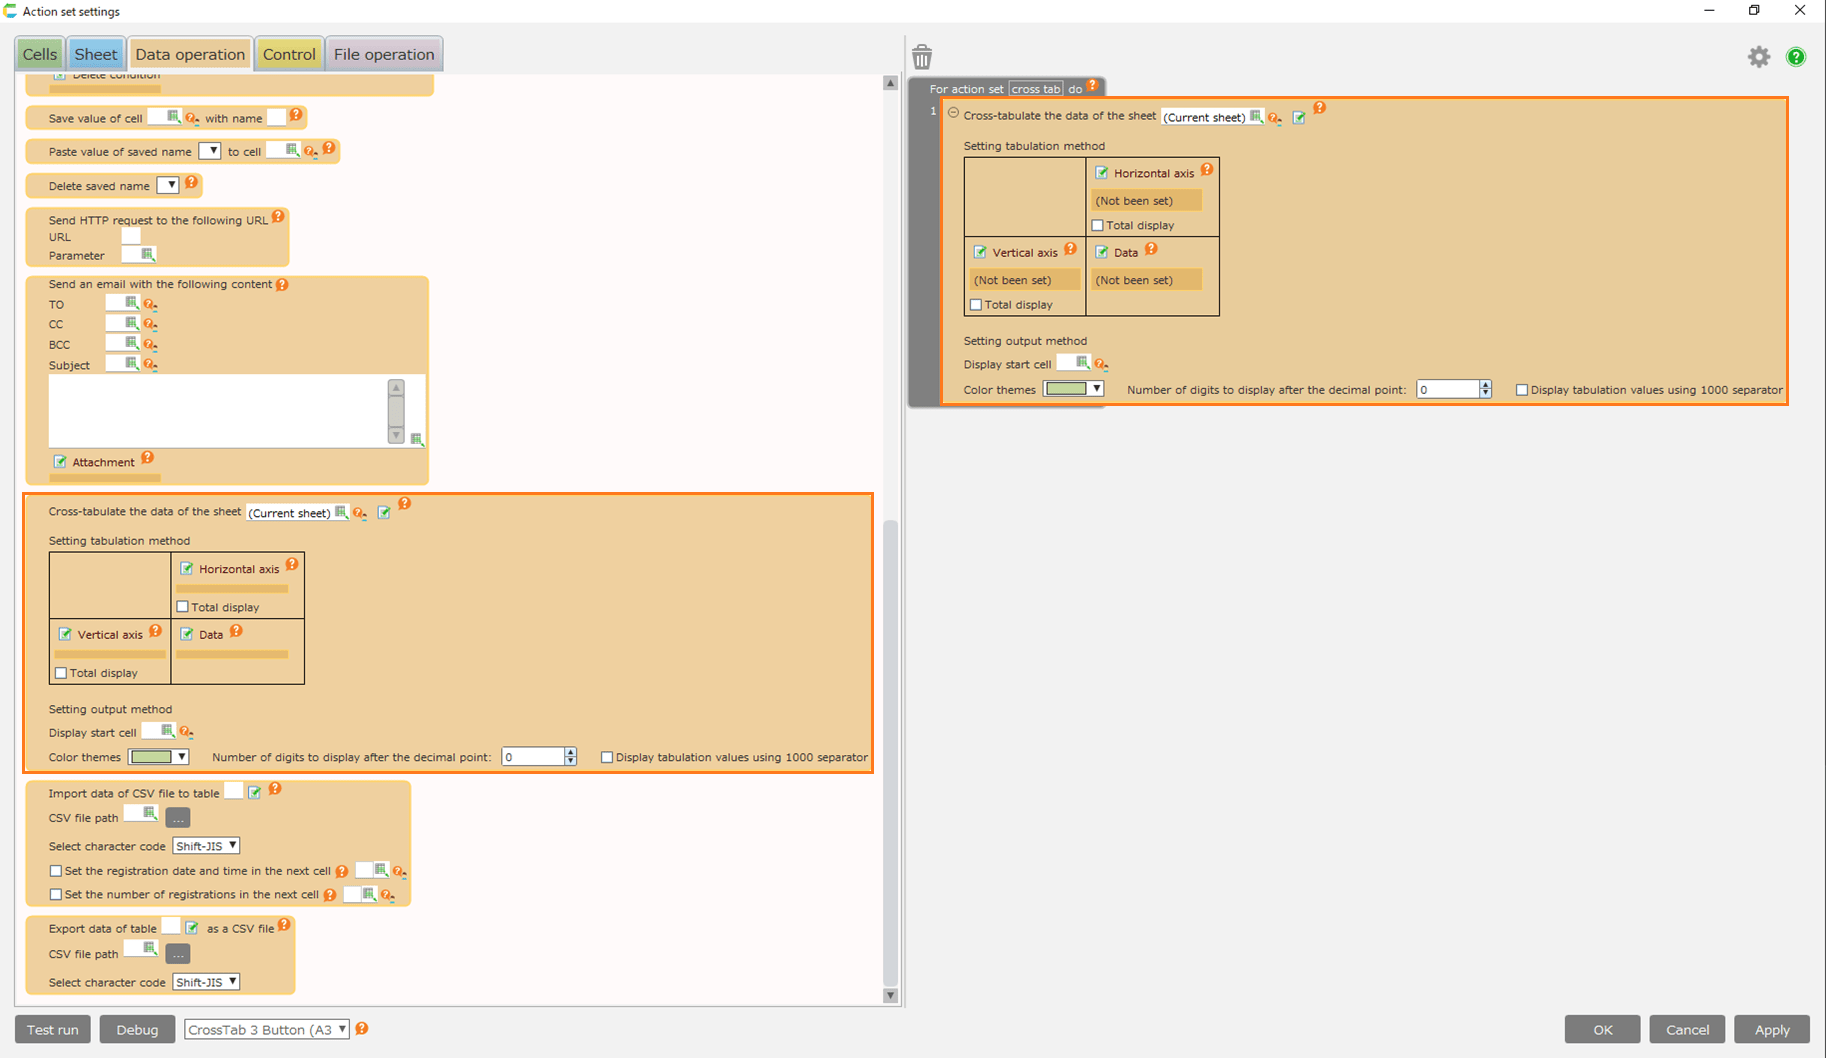
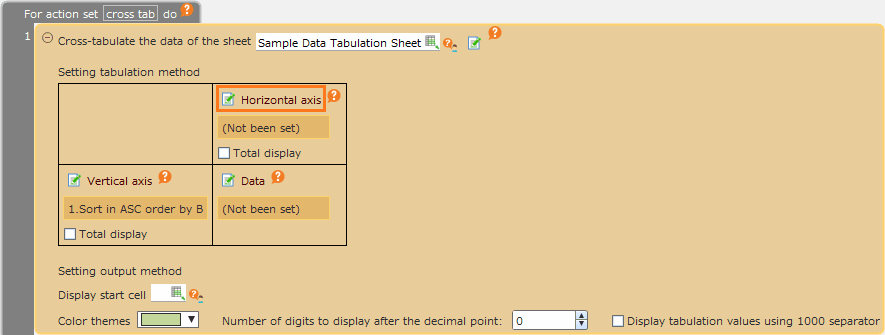
- Open 'Action set setting' dialog, drag 'Cross-tabulate the data of the sheet' action from 'Data operation' sheet, then set into the edit area.
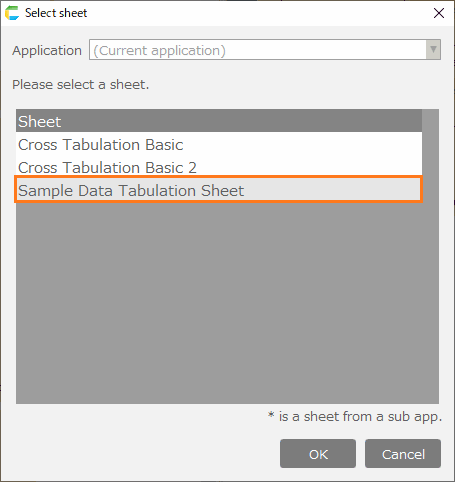
- Click 'Select sheet' button.
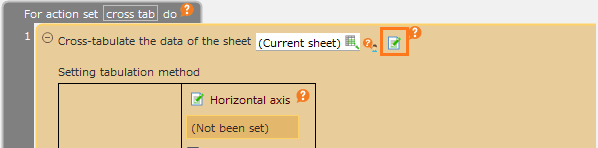
- Choose the sheet created at No.1, click 'OK' button.
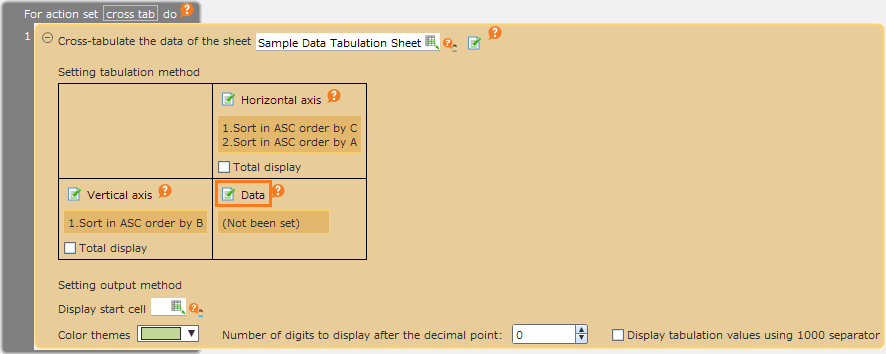
Set how to summarize
In order to set how to summarize, you need to set Vertical axis, Horizontal axis and target summary data.
Set Vertical Axis
Set the field to use as Vertical axis of Cross-tabulate.
- Click 'Setting item of vertical axis' link button.
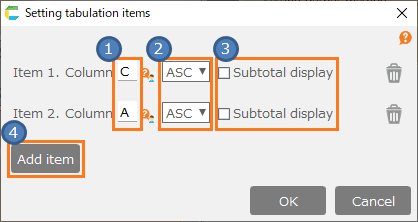
- Set vertical axis information in 'Setting tabulation items' dialog.
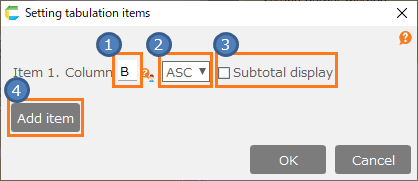
- [1] Column
- Set the column number on the sheet to set as vertical axis.
- [2] Order
- Set the order displayed by set field data as vertical axis. You can choose 'Ascend' or 'Descend'
- [3] Subtotal Displaying
- [4] Add field
- If there are multiple fields to set as vertical axis, you can add the vertical axis information by clicking 'Add item' button.
Tip
'Goods' column (B column) is set as vertical axis above.
- Click 'OK' button.
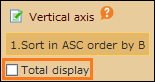
Tip
If 'Total display' in Vertical axis is checked, Total row is displayed.
Set Horizontal axis.
Set field to use Cross-tabulate as Horizontal axis.
- Click 'Setting item of horizontal axis' link button.
- Set horizontal axis information in 'Setting tabulation items' dialog.
- [1] Column
- Set the column number(A,B,C…) on the sheet as horizontal axis.
- [2] Order
- Set the order displayed by set field data as horizontal axis. You can choose 'Ascend' or 'Descend'.
- [3] Subtotal Displaying
- [4] Add field
- If there are multiple fields to set as horizontal axis, you can add the horizontal axis information by clicking 'Add item' button.
Tip
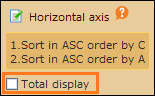
'Month' column (C column) is set and 'Store' column (A column) is set as horizontal axis above.
- Click 'OK' button.
Tip
If 'Total display' in Horizontal axis is checked, Total row is displayed
Set Data
Set the data field to be the target summary data.
- Click 'Data' link button.
- Set target summary data in 'Setting tabulation items' dialog.
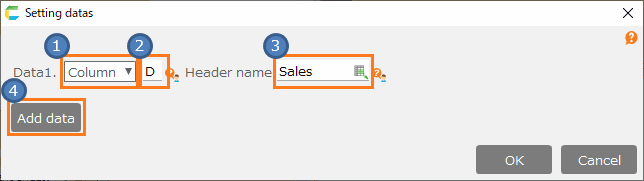
- [1] Data Type
- You can choose 'column' or 'formula'.
- [2] Data
- [3] Header name
- Set the header name to be displayed at the output data.
- [4] Add data
- If you need multi-target summary data fields, click 'Add data' button, then you can add the data information.
Tip
Set 'Sales' column (D column) as target summary data above.
- Click 'OK' button.
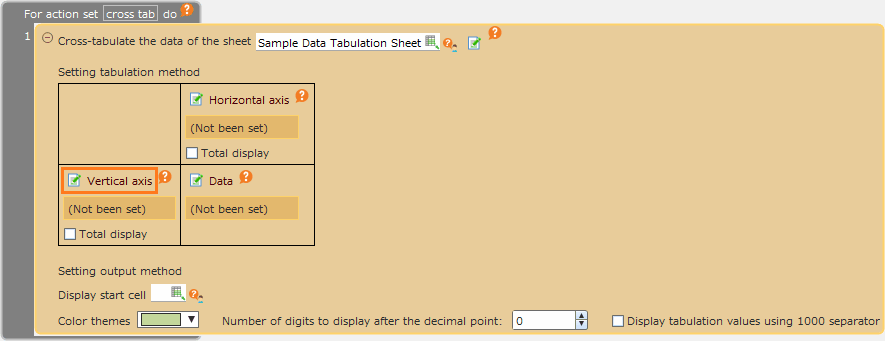
Set how to output
- Set how to output.
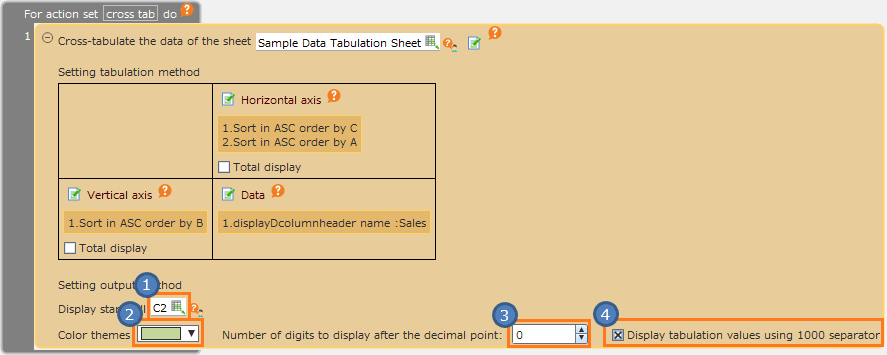
- [1] Display start cell
- Set the starting cell for output (at top left).
- [2] Select color theme
- Set the color to the header.
- [3] Decimal places
- Set the decimal places.
- [4] Display tabulation values using 1000 separator
- If checked, the target summary result of the data field is displayed with comma delimiter.
Related keywords
poivot table, pivottable